CO₂ NEGATIVE
The digital
footprint.
Made visible.
An illustrated website and a carbon-reporting workspace. One connected design, from the first estimate to the company overview.
Explore the design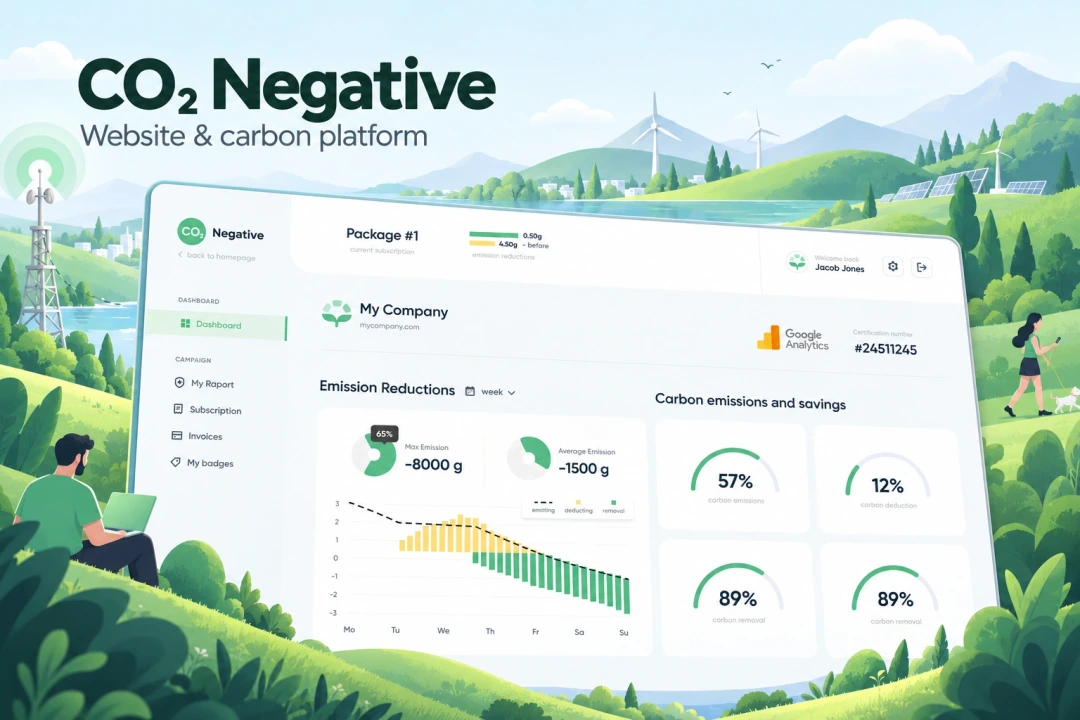
- Our scope
- Website & platform UX/UI
Desktop & mobile layouts - The experience
- Calculator · carbon reports
Illustrated pages · website badges - Project contact
- Tung Chan
EXPLORE THE DESIGN
The website. The result. The ongoing view.
Explore the public website, calculator result, account reporting, badge workspace and mobile layouts.
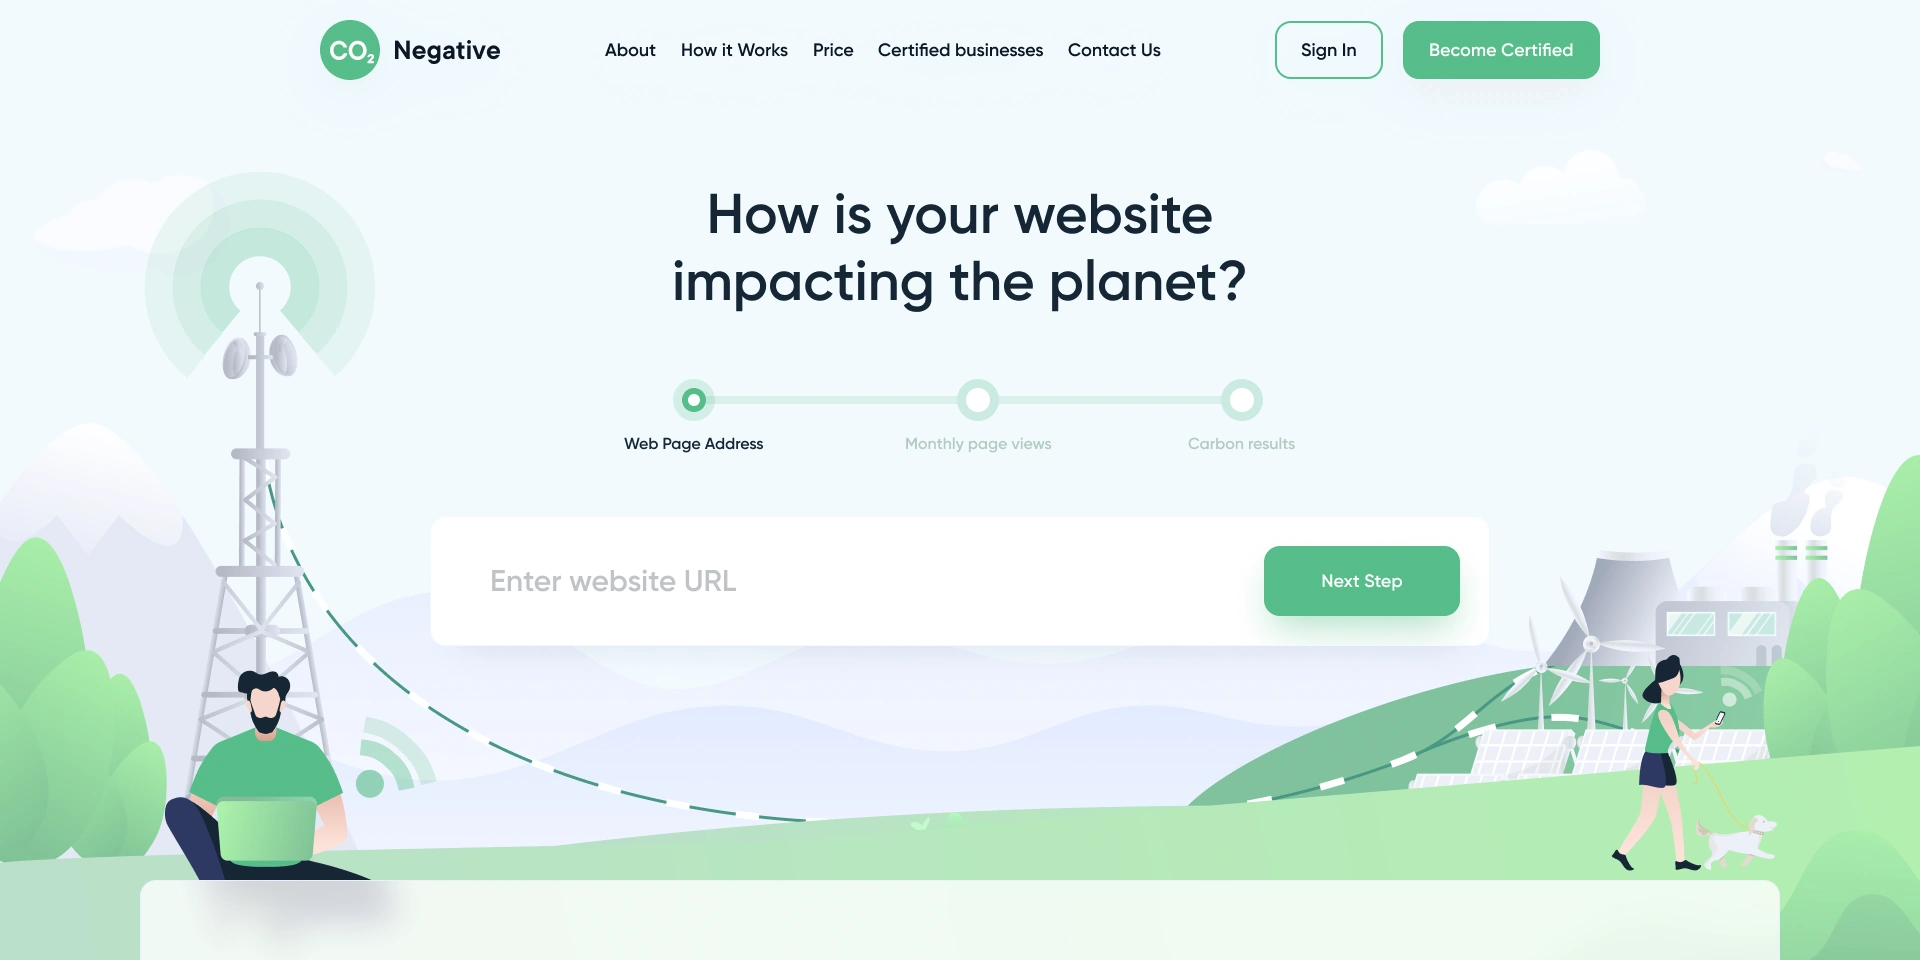
Website opening — three calculator stages within an illustrated environmental landscape
Choose a preview or use the arrows. Open a screen for the complete layout.
01WEBSITE & CALCULATOR UX/UI
Make an unfamiliar service easy to enter.
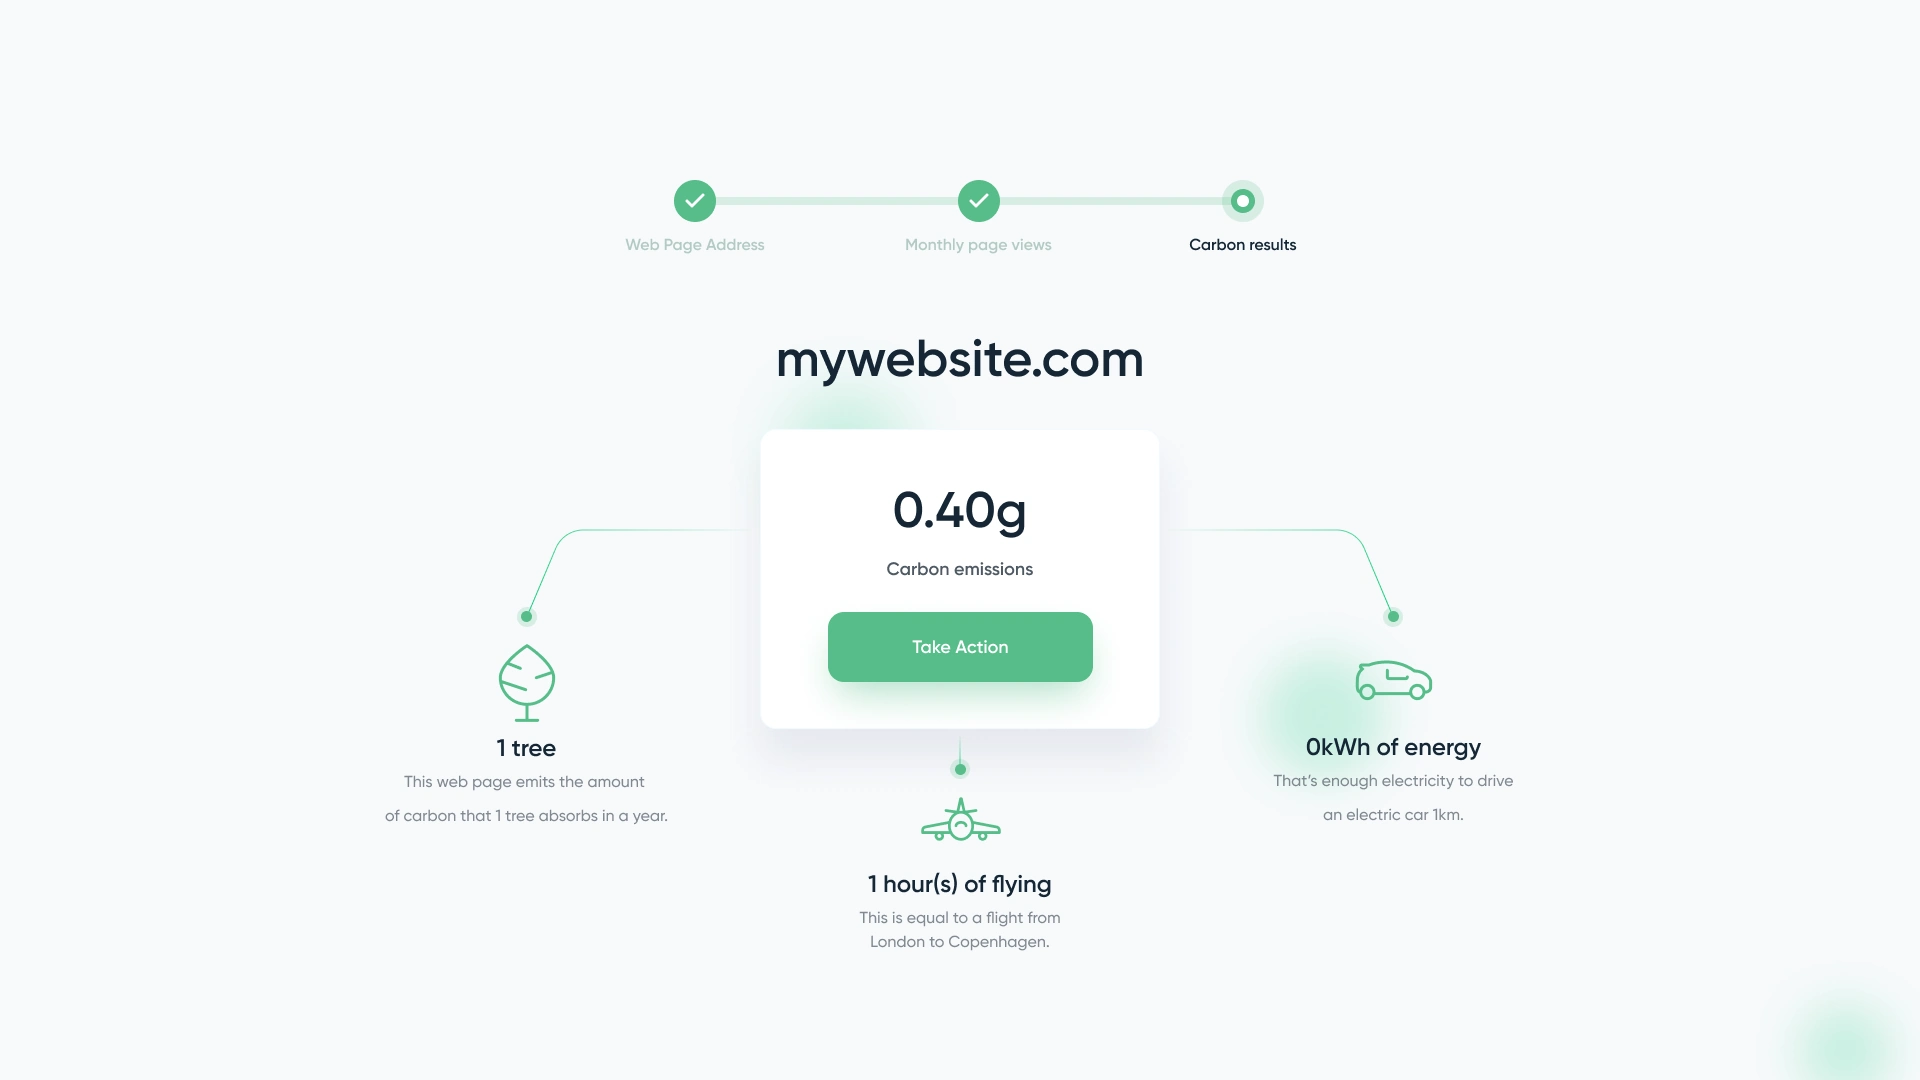
The website introduces a digital-carbon service through a familiar starting point: a website address. The calculator divides that journey into three named stages, ending in a result rather than presenting every choice at once. Its result view groups a headline figure, contextual comparisons and a clear next action.
A custom illustrated landscape gives the public website its character. The how-it-works section uses related illustrations and distinct topic tabs to explain the service. Our website UX/UI connects these explanatory pages with the calculator through consistent green actions, rounded surfaces and typography.
02REPORTING & RESPONSIVE DESIGN
A clearer view of the information behind the number.
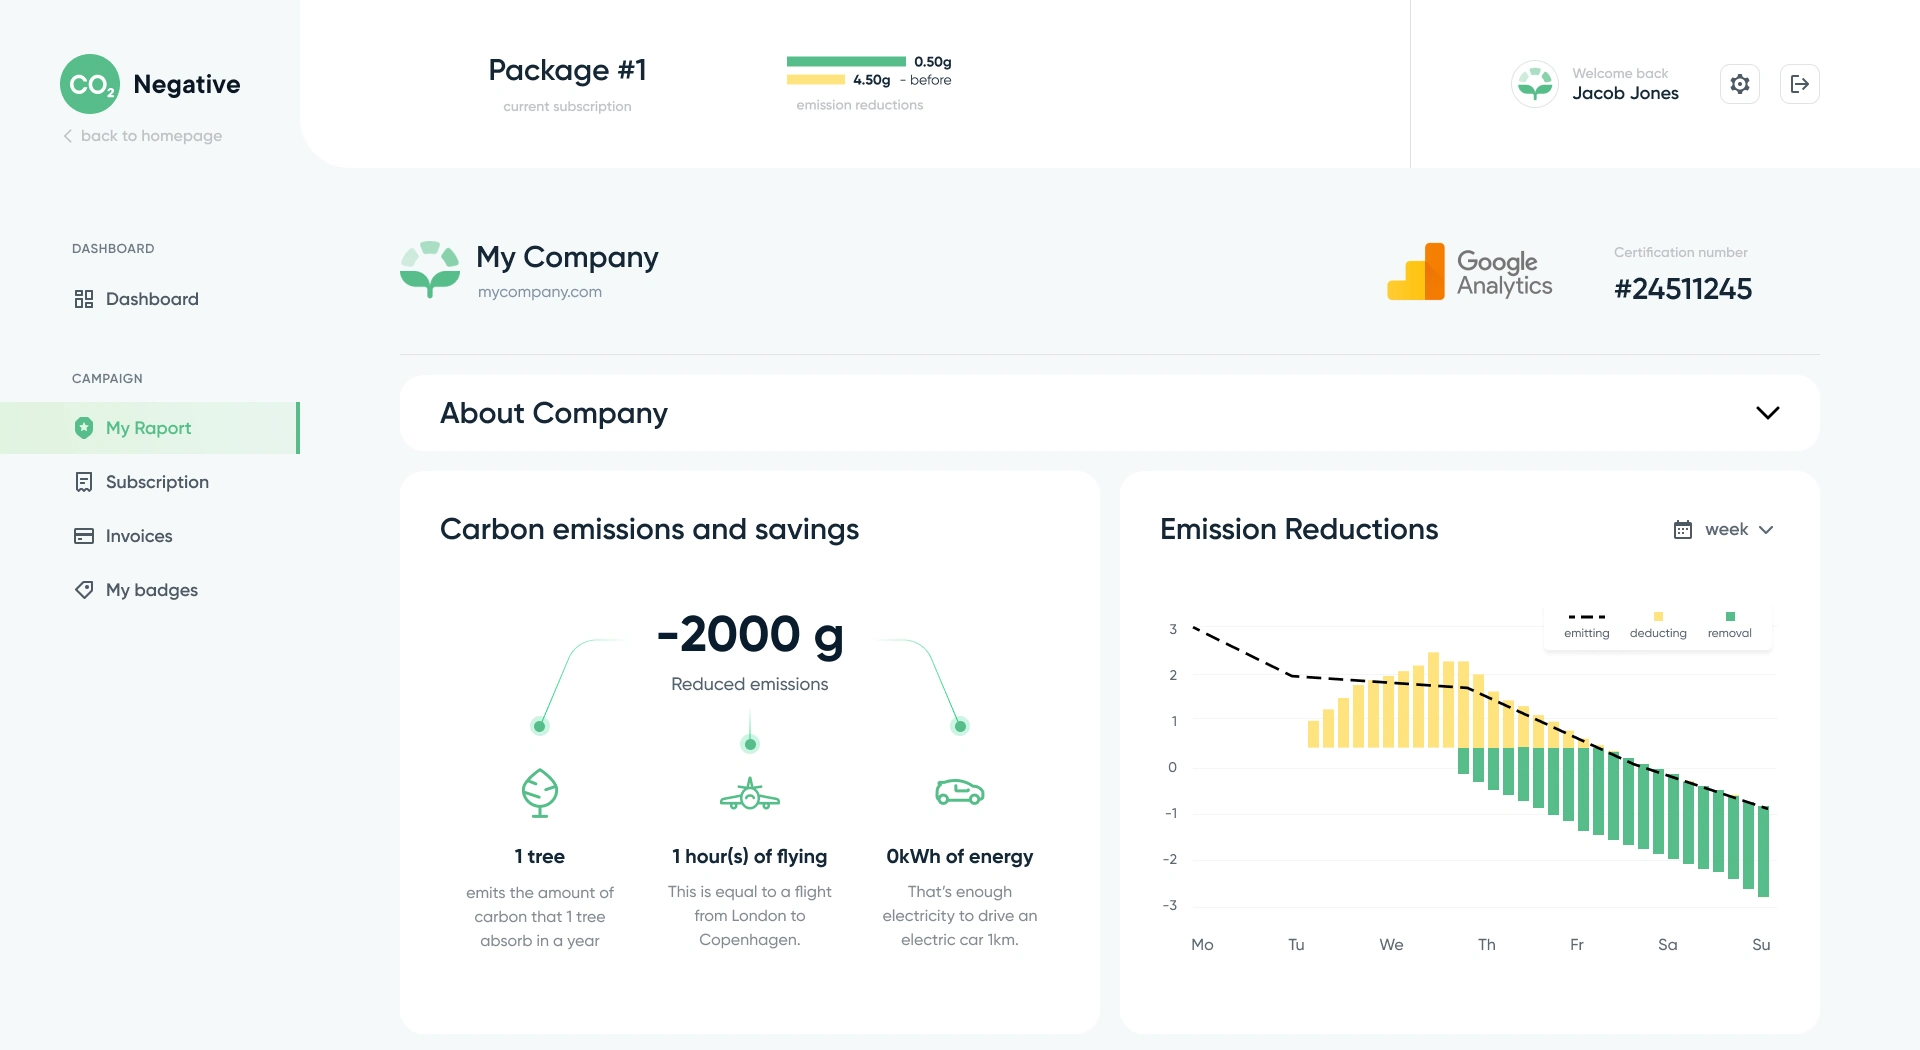
The account overview separates the emissions chart from summary gauges, with a shared navigation for reports, subscription information and website badges. A dedicated report pairs the chart with a contextual carbon summary, giving the company a focused view of the information behind its headline figure.
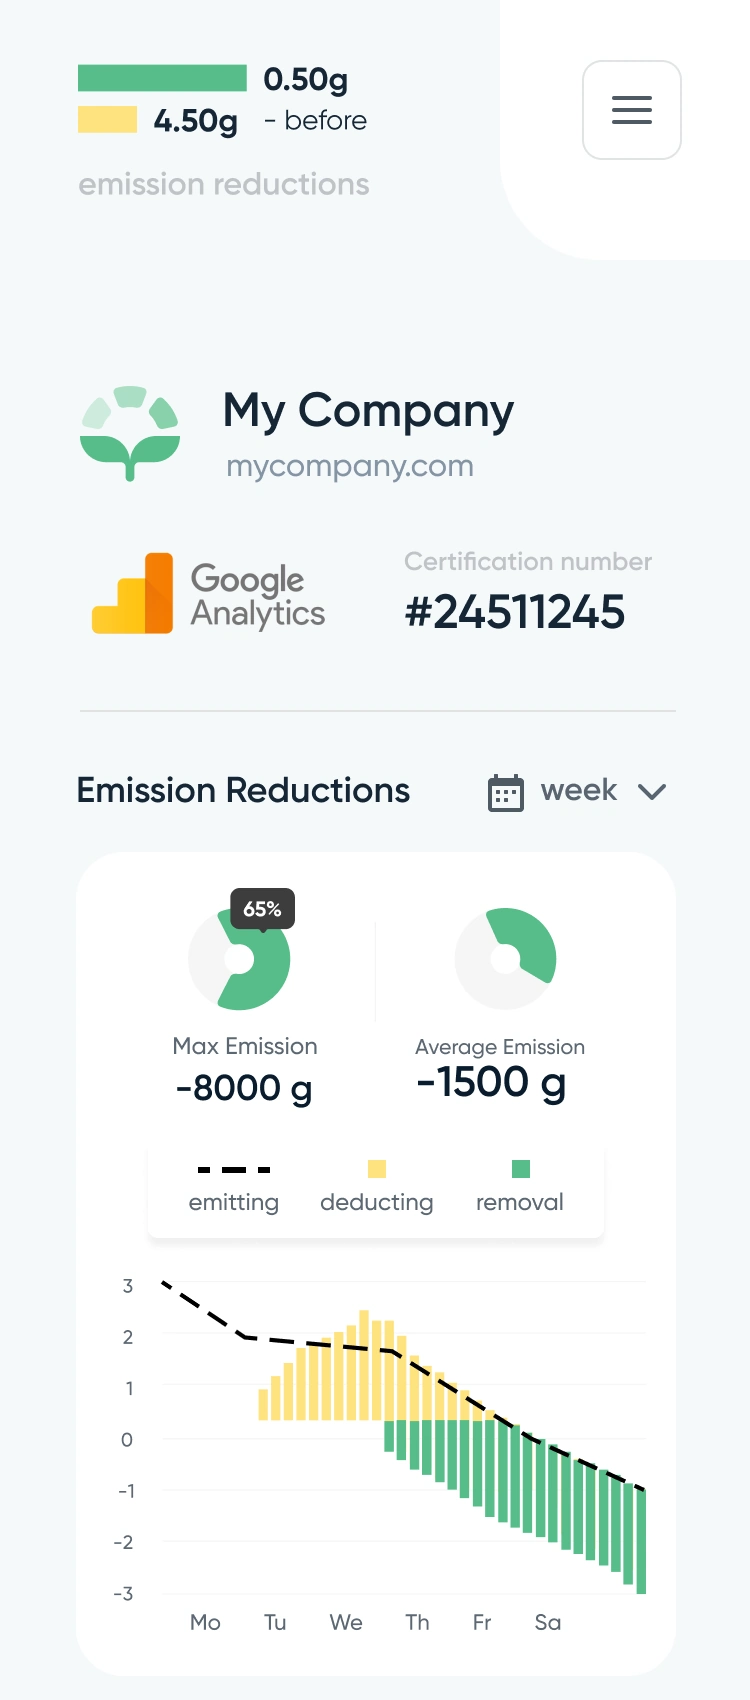
The badge workspace brings colour selection, a preview and the insertion action together. On mobile, the reporting information becomes a vertical sequence of company context, summary values and a chart. Our responsive UX/UI design carries the same information hierarchy from the public website into the account.
A complex service.
A clearer experience.
Planning a website with a product behind it? Tell us what the service does and who needs to understand it. We’ll suggest a scope and estimate.
Get a project estimateExplore the design in Figma